

Mike Tisdell, Chirpy Heat
In order to understand something, you sometimes need to look at it in a different way. A good example of this is trying to understand the real economic growth of China. Whilst China produces lots of data it is not independently verified so economists have come up with a variety of proxies such as seaport container traffic, car sales, electricity consumption and others to actually assess growth. For some countries the number of lights on at night that can be seen from satellites has also been used.
Amazingly there are some parallels with heat networks – they produce lots of data – far more than most of types of heating systems, but we are only now beginning to understand how many heat networks there actually are in UK. And knowing this is very important – it matters to landlords, customers and as we approach full regulation in 2024, it matters to the government and Ofgem.
So, we decided to take a different view to see if we can add more to our understanding of heat networks in the UK. And to do this we looked at different data source – the census. With a response rate of 97% of households, the answer to the census question on how your home is heated should give us the most comprehensive picture of heat network coverage available. However, how many residents really understand that they live on a communal heat network and pay their housing provider for heat and hot water generated outside their residence?

A quick review of the Census data in England tells us that the vast majority of the Census’ Output Areas, which is the smallest geographical unit of census statistics, had zero respondents reporting that their homes were on a communal or district heating network (approximately 90% of the Output Areas). This might not be too much of a surprise, since we would expect communal heating systems to be largely concentrated in urban areas and existing estimations of heat network coverage are relatively small; a common figure being 14,000 heat networks in the UK serving roughly 450,000 homes, which would account for less than 2% of the UK’s 24.8m households.
Despite this, we might still expect most domestic communal heating systems to be relatively large buildings. However, of the nearly 20,000 output areas which return at least one response identifying their heating system as communal or district heating, more than 17,000 output areas 10 or less respondents on a heat network, with more than half (9829) returning only one respondent identifying their heating as communal or district. When we look specifically at areas we know to have large communal heating systems (which I encourage anybody reading this to do (simply type in the postcode in the map here)), we can start to get a picture of the scale of under-reporting.
So what does this look like in practice?
I have included a couple of indicative examples below:
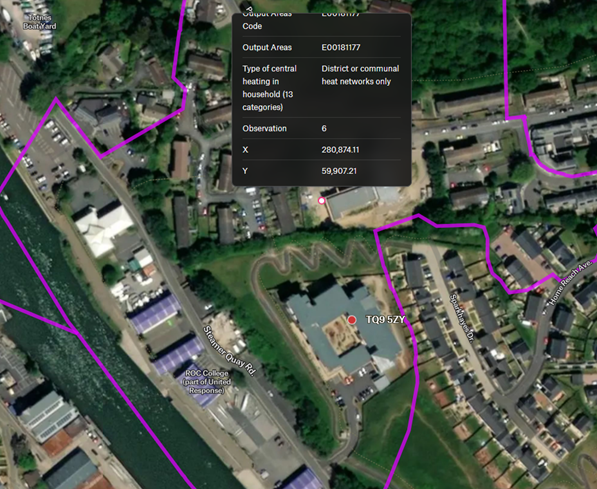
Quayside Extra Care (The Guinness Partnership) – a 60 home heat network, only 6 census responses in this output area identified their heating as communal or district (Source: Quayside, Totnes – Guru Systems).
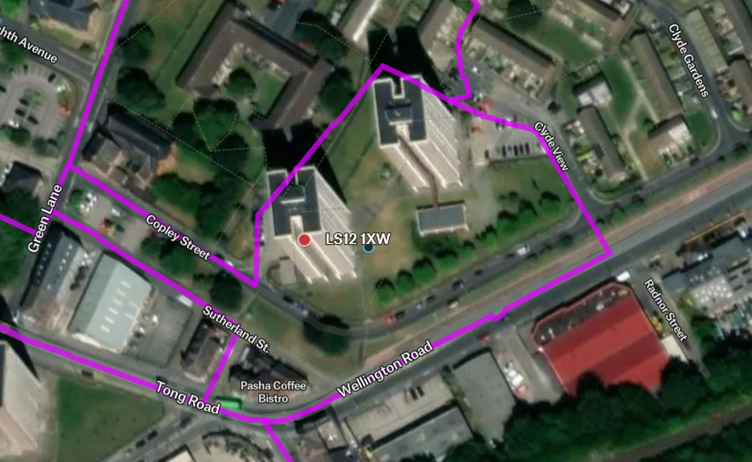
Clyde Court & Clyde Grange in Leeds, two tower blocks connected to a district heating system with 229 dwellings – only 20 census responses identified their heating as communal or district heating (Source: Leeds District Heating to Tower Blocks – Case Study – Fortem).
Why this matters?
If the census results really suggest that many residents are simply not conscious that they are on a heat network, this could perhaps be interpreted as an understated benefit of communal and district heating. Perhaps often, heat networks are delivering heating and hot water in such a hassle-free way that residents never have cause to consider or interrogate how their heating system operates, it ‘just works’. However, confusion over the term ‘heat network’ itself and where this applies is also widespread and many census respondents may have been aware their heating is provided by a communal gas boiler (for example) and simply ticked this option. It will also have significant impacts for the development and delivery of customer protection that lies at the heart of full regulation in 2024.
What the census data does give us, perhaps for the first time, is a new map of existing heat networks and a sense of how these are distributed across the country. For sure it is only partial, but it is one more layer that will help our understanding. This is one part of the puzzle of building a more detailed picture of existing ‘legacy’ communal heat networks across the country that I think the move to full regulation in the sector will help to accelerate. If not the primary purpose, it seems that an increased awareness on the part of residents of both the relationship between the heat supplier and themselves as the final customer, as well as a greater transparency as to how they receive and pay for their heating, will also be a part of this process. If so, perhaps 10 years from now we’ll have a much more comprehensive census map to play around with.